
In-situ leaching (ISL), also known as solution mining or in-situ recovery (ISR), involves leaving ore in the ground, and recovering the minerals by dissolving them. The pregnant solution is pumped to the surface where minerals can be recovered. In-situ leaching is used for example for uranium mining.
Leaching agents, containing acids (i.e. sulfuric acid) or alkali mixed with oxidants (i.e. hydrogen peroxide), are pumped into the ground, returning with solved uranium. ISL wellfields vary greatly depending on local conditions such as permeability, sand thickness, deposit type, ore grade and distribution. Using on-line analysis to monitor uranium recovery, enables operators to switch between several streams of injection and extraction wells. This allows control and the possibility to steer acid consumption resulting in a constant uranium in-flux for further solvent extraction (SX). A more constant in-flux leads to reduced energy consumption and costs.
This application note demonstrates the analytical capability and stability of the Epsilon Xflow to monitor on-line the in-situ leaching of uranium from its host rock.
Measurements were performed using a Malvern Panalytical Epsilon Xflow EDXRF spectrometer, equipped with a 50 kV silver anode X-ray tube, 6 beam filters, and a high-resolution Silicon Drift Detector SDD30. The system is equipped with a flow cell, where the solution is pumped through and analyzed.
All samples were prepared out of commercially available ICP standards. 6 set up standards were made with varying SO4, U and Fe concentrations. Measurement procedure Approximately 100 ml of each samples were pumped continuously through the flow cell during analysis. The used measurement conditions are listed in table 1.
| Compound | kV | μA | Medium | Filter | Meas. time (s) |
|---|---|---|---|---|---|
| SO4 | 9 | 1650 | Air | Ti | 60 |
| Fe | 20 | 550 | Air | Al Thick | 60 |
| U | 50 | 65 | Air | Ag | 60 |
Table 1. The used measurement conditions
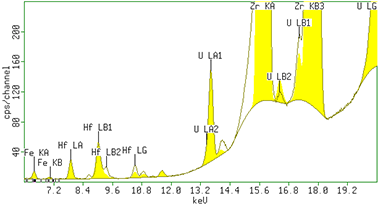
Figure 1. The spectrum of a setup sample containing 250 mg/kg U and 50 mg/kg Fe obtained using the condition for Uranium. The Hf and Zr signal originated from the fixed reference material in the flow cell.
In figure 1 an XRF spectrum of a sample with 250 mg/kg Uranium and 50 mg/kg Iron is shown. Figure 2 and 3 show the calibration plots for uranium and sulphate, respectively. The measured intensities correspond with the expected concentrations in the samples resulting in linear calibration curves. The results are summarized in table 2. In the table the RMS value and the correlation of the measurements to the calibration curve are also included. A lower limit of detection (LLD, 3 sigma) was determined using a blank H2SO4 sample. For a 60 sec measurement, the reported LLDs for U is 0.9 mg/kg and for Fe 0.6 mg/kg.
| Compound | Concentration Range | RMS* | Correlation | LLD in 60s |
|---|---|---|---|---|
| SO4 |
0.72 - 2.22 wt-% | 0.003 wt-% | 0.9899 | n.a. |
| Fe | 0 – 1000 mg/kg | 5.4 mg/kg | 0.9994 | 0.6 mg/kg |
| U | 0 – 1000 mg/kg | 9.8 mg/kg | 0.9996 | 1 mg/kg |
Table 2. Calibration details (*RMS: The more accurate calibrations have smaller RMS values).
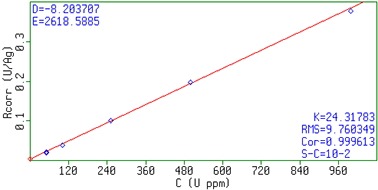
Figure 2. Calibration graph for U in sulphuric acid.
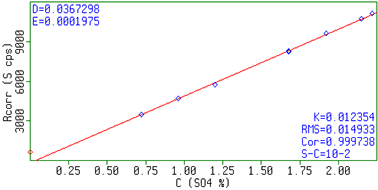
Figure 3. Calibration graph for SO4.
To test the repeatability and accuracy, one of the setup samples was measured over a period of 5 days. During the measurement 100 ml of liquid was circulated continuously through the flow cell. The obtained data of the repeatability test for Fe and U is plotted in figure 4, and the results including SO4 concentration are summarized in table 3.
Before and after analysis a clear H2SO4 sample was measured to evaluate foiling of the flow cell window during analysis. After analysis it was possible to return to the start situation, which indicates no foiling of the window.
For Fe and SO4 the measured concentration is close to the target concentration. For U there is a small difference, but a similar off-set was observed when this sample was used in the set-up of the calibration line in figure 2. It seems the effective Uranium concentration in the specific sample was slightly higher as the targeted concentration.
For all three compounds the Epsilon Xflow showed a high precision with a relative standard deviation around the 0.5%.
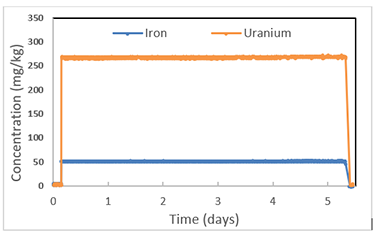
Figure 4. Repeatability measurement over a period of 5 days of one of the setup samples.
|
Compound |
Targeted concentration |
Measured Concentration |
RMS |
Rel. RMS (%) |
|---|---|---|---|---|
| SO4 |
2.22 wt-% | 2.04 wt-% | 0.01 wt-% | 0.4 |
| Fe | 50 mg/kg | 51 mg/kg | 0.3 mg/kg | 0.4 |
| U | 250 mg/kg | 269 mg/kg | 1.0 mg/kg | 0.6 |
The data presented in this application note demonstrates the capability of the Epsilon Xflow EDXRF spectrometer for real-time monitoring of in-situ leaching processes for uranium.
The results from the repeatability tests illustrate the stability and robustness of the Epsilon Xflow. The combination of excellent detector resolution, high sensitivity and powerful software deconvolution models contribute to the accuracy and precision of the results.
Malvern Panalytical offers besides the Epsilon Xflow a wide range of sample conditioning solutions for seamless integration of the Epsilon Xflow into real production process. This includes the filtering for reproducible sample representation during analysis.